|
|
Haarp Moon Bounce Experiment
previous article
next
The HAARP Moonbounce Experiment.
The HAARP 7 MHz moonbounce tests were repeated on January
19, 20 of 2008. This time
the event and the frequencies were
announced ahead of time so that many of us amateur
radio operators
could participate.
In my case, the antenna was a Butternut HF2V 30ft tall vertical antenna. A
vertical antenna was probably the worst type of antenna for this experiment.
Receiving location is approximately 26o
27' 11"' north 80o 07' 29" west.
The
receiver was the Transworld TW100F. These images were produced by "Argo". Because I did not have
a lot of advanced notice of
this event, I simply placed a microphone next to the speaker of the TW100F transceiver
and plugged it
into the laptop. Although I had downloaded Argo a few weeks ago, this was
my first time using it.
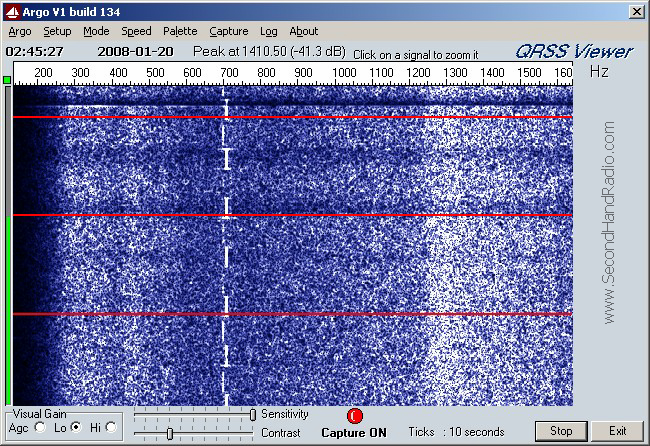
So I missed most of the first test on 6.7925 MHz at 01:30 local time January 20,
2008. I do have a few screen captures from that test, but you will notice that no echoes were detected.
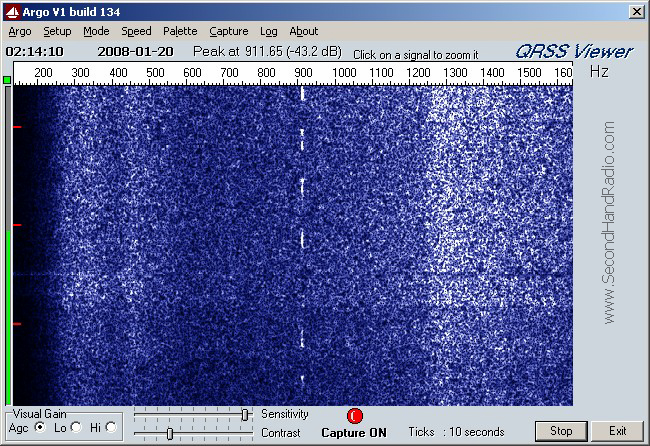
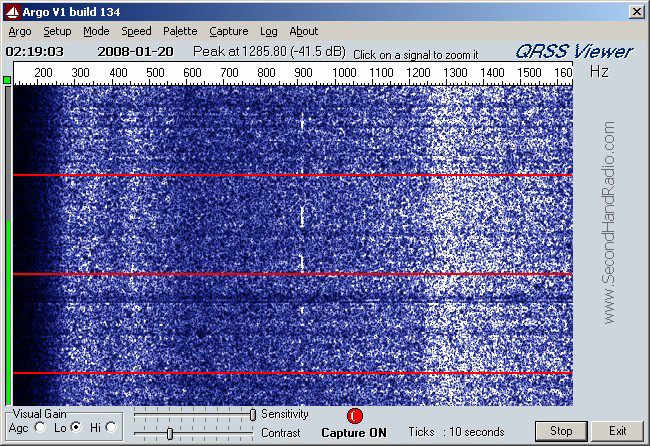
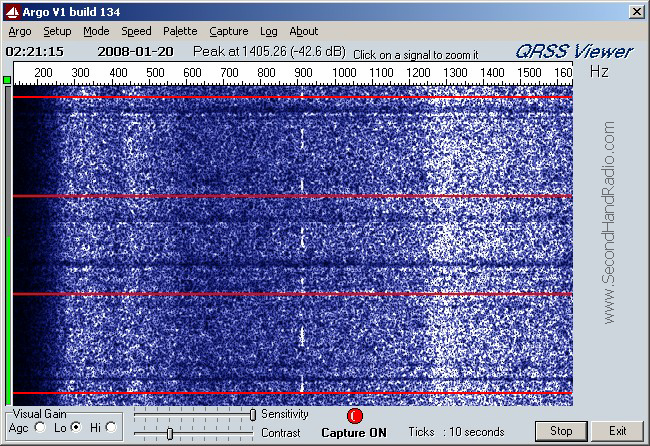
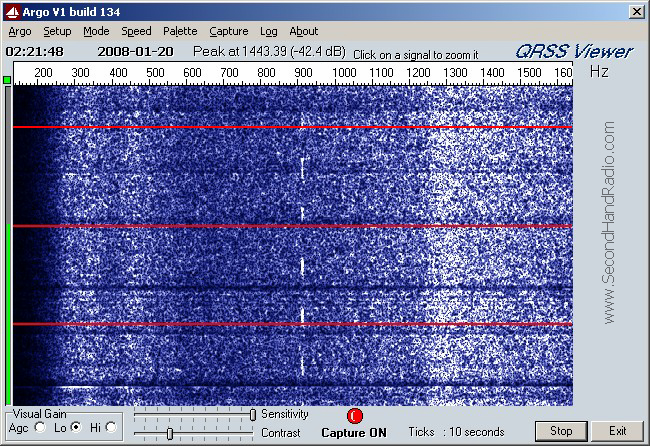
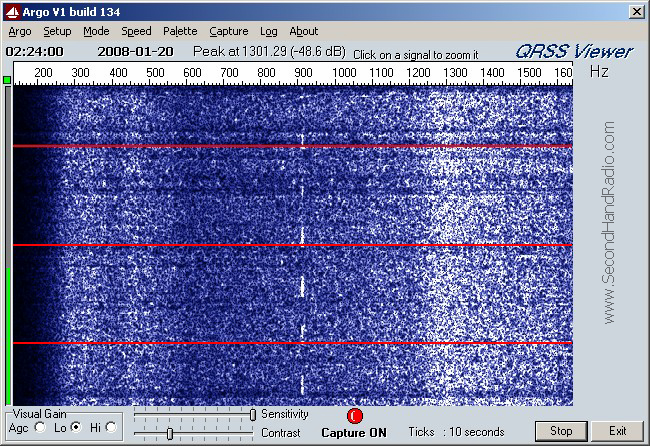
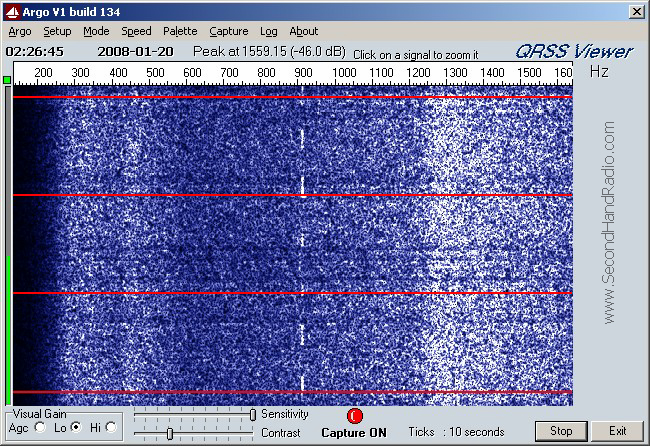
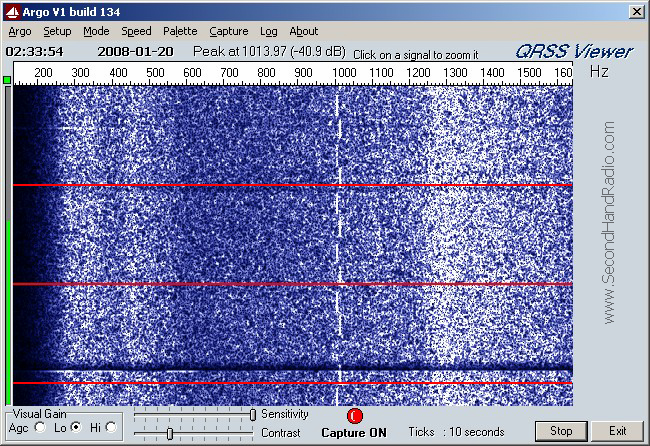
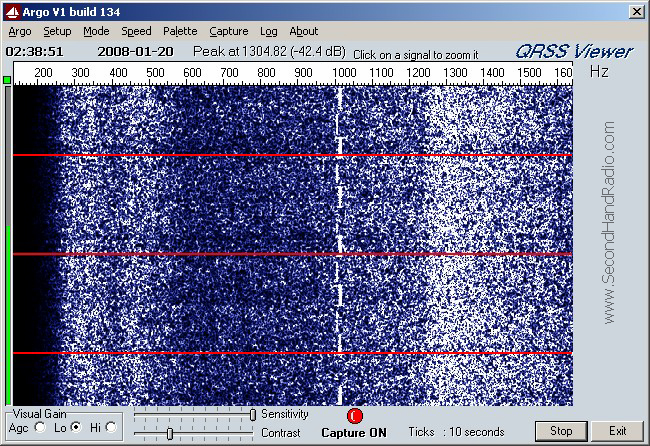
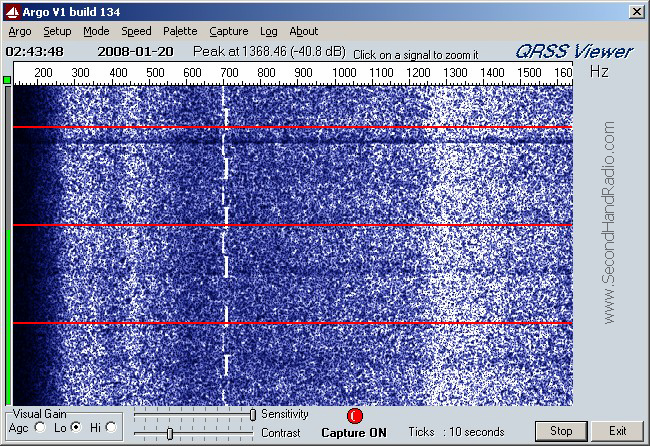
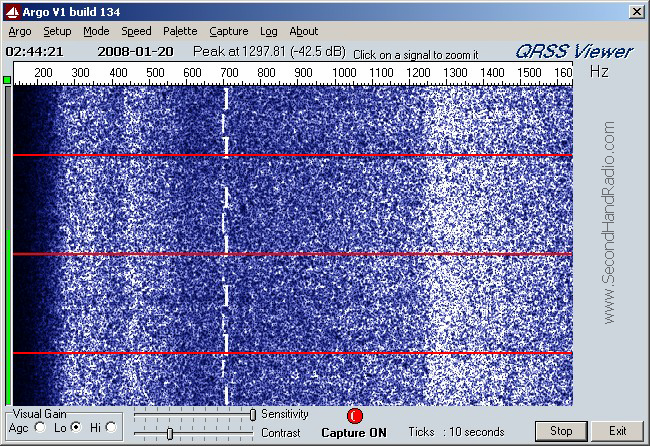
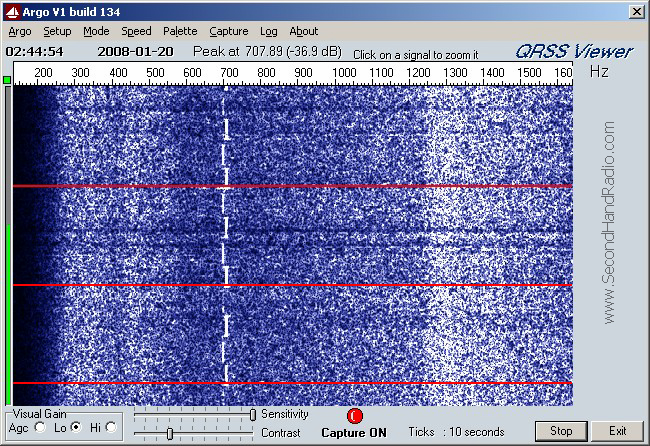
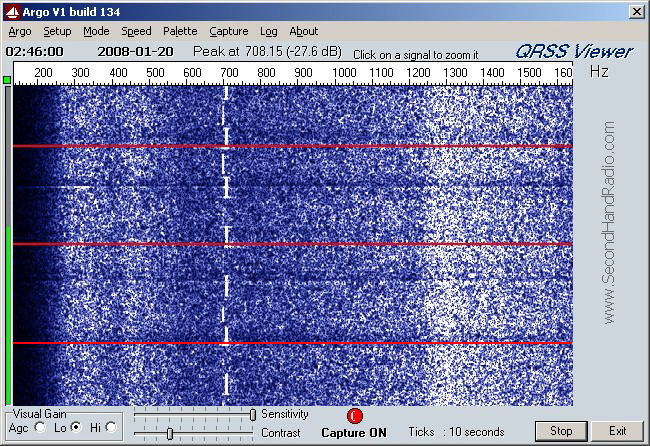
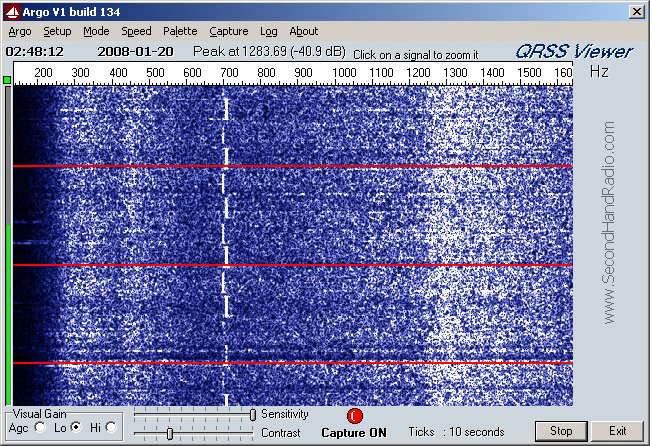
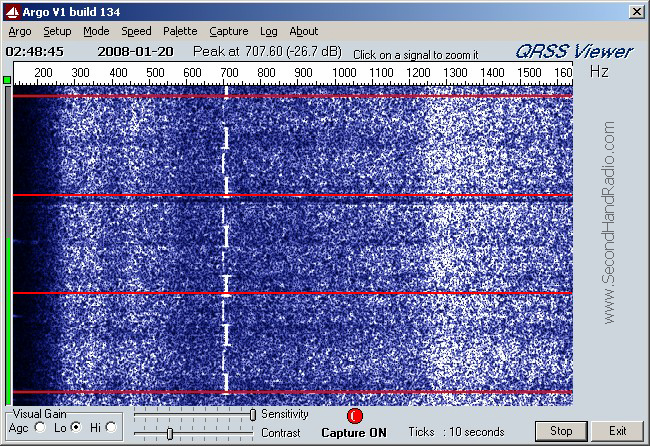
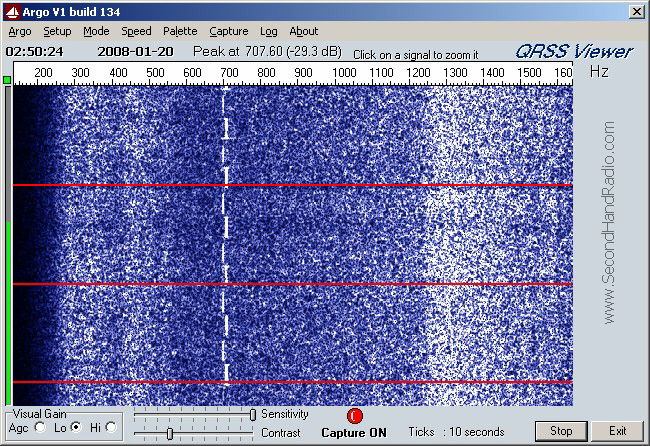
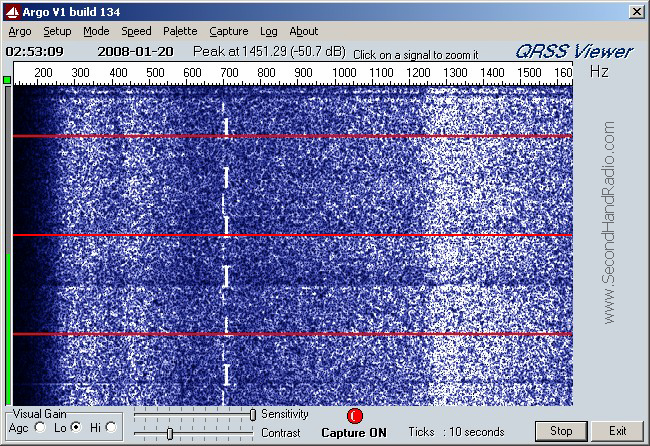
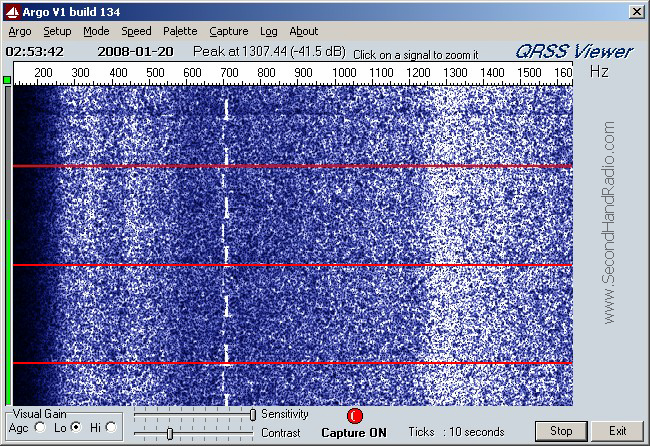
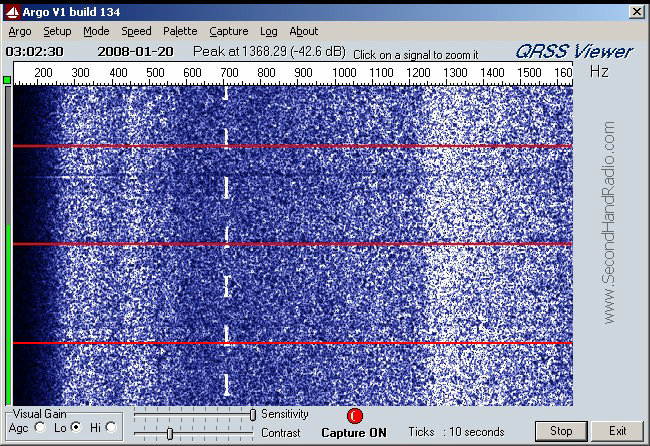
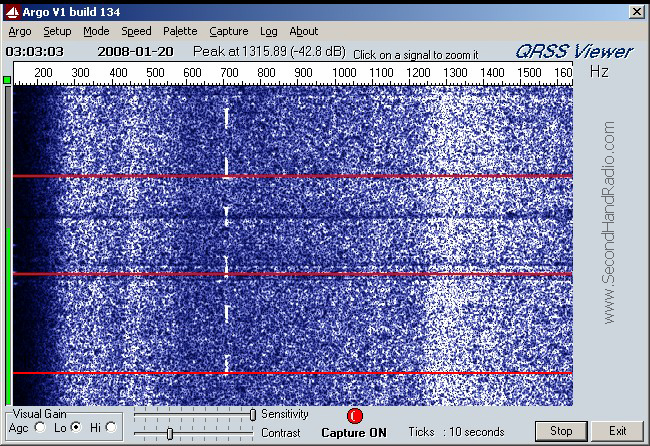
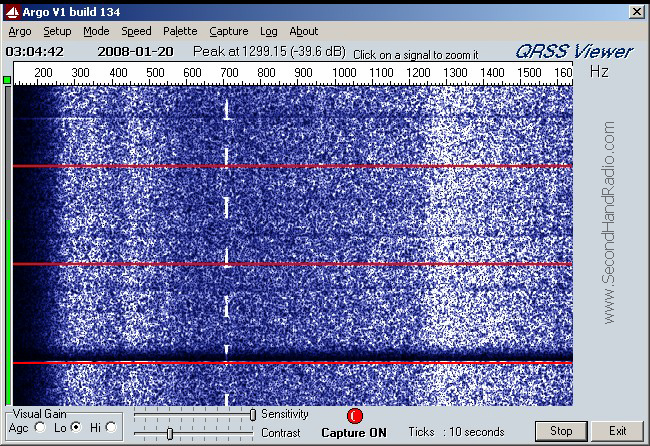
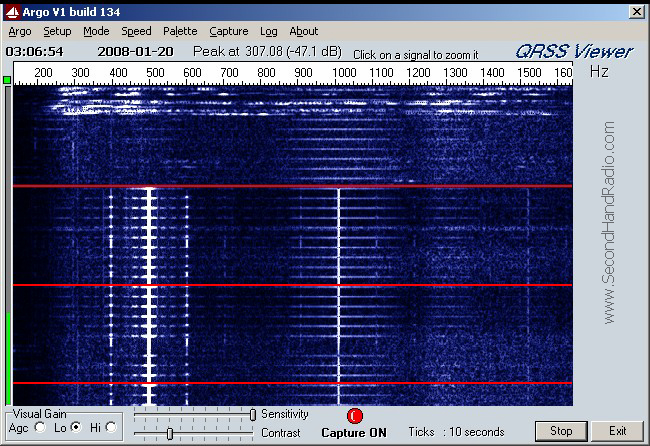
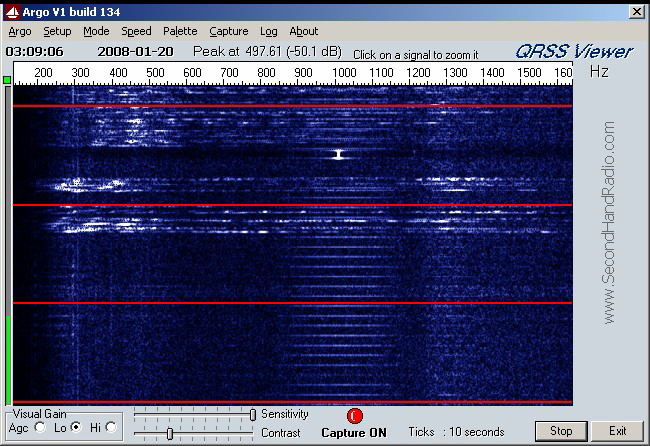
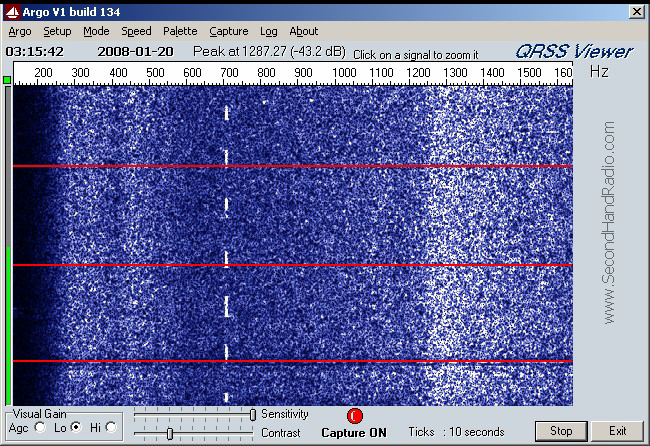
The first thing I want to point out is the frequency response of the receiver, the
speaker, and the microphone as
a system. If the response were 'flat' the white noise would be even everywhere.
Note here that below 250 Hz
there is almost no image. This means that from 0 to 250 Hz there is no 'signal'.
Next note that around 1200 to
1500 Hz the images are brighter. This means that the response of my system
accentuates signals in this range.
(Most of this effect is probably the radios output speaker.)
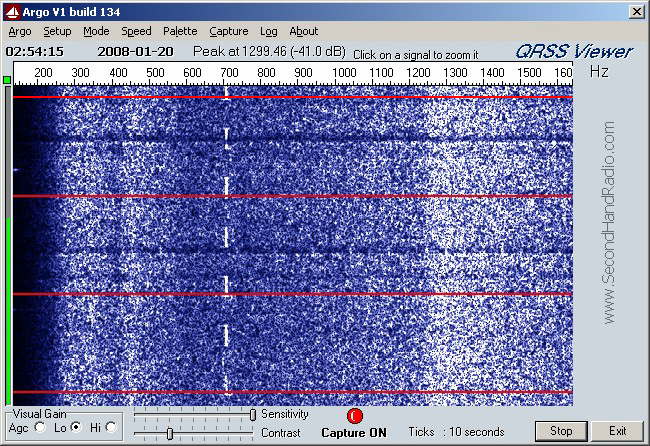
In the top left of each image is the time of the screen capture in eastern standard
time. Add 5 hours for UTC.
This is the ENDING time of the frame. The red 'ticks' (lines) in the image
are 10 seconds apart.
Echoes can be clearly seen in some of the later images. These were obtained
by setting the radio in "USB mode"
with an indicated frequency of 7406.5 kHz.
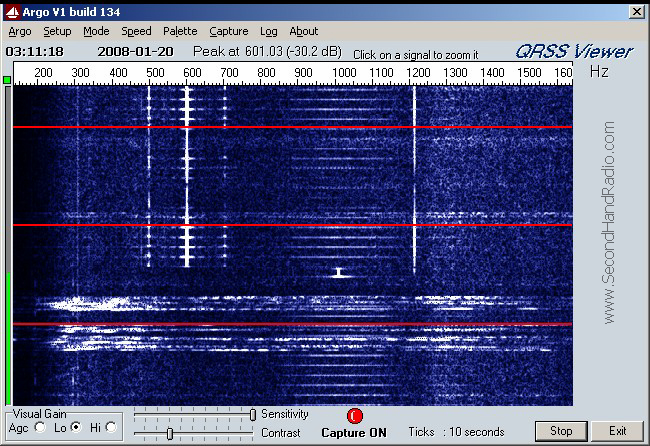
Picture 1
Radio frequency was not logged. Probably 6.7916 or so. Thus the 6792.5
kHz from the HAARP
transmitter can be see at an audio frequency of 915 Hz. The HAARP station
transmitted A1A emissions
(cw) for 2 seconds on, 3 seconds off. This can be clearly seen in this image
at 02:12:31 e.s.t.

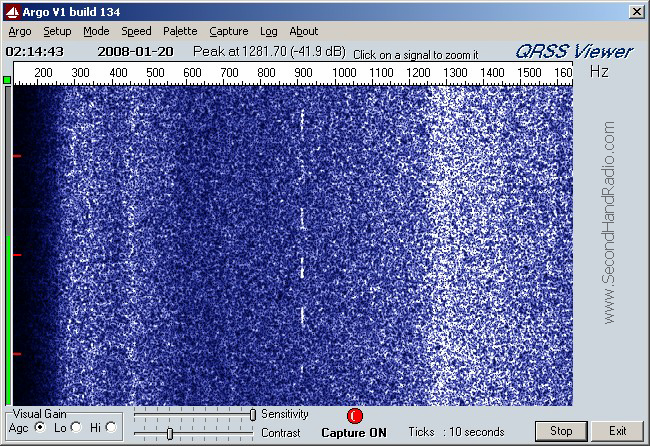
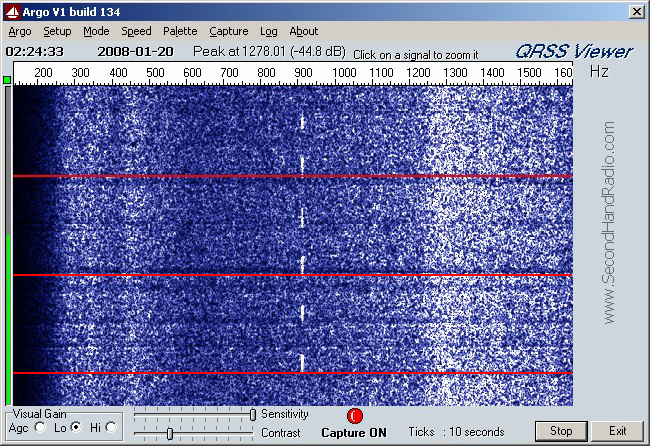
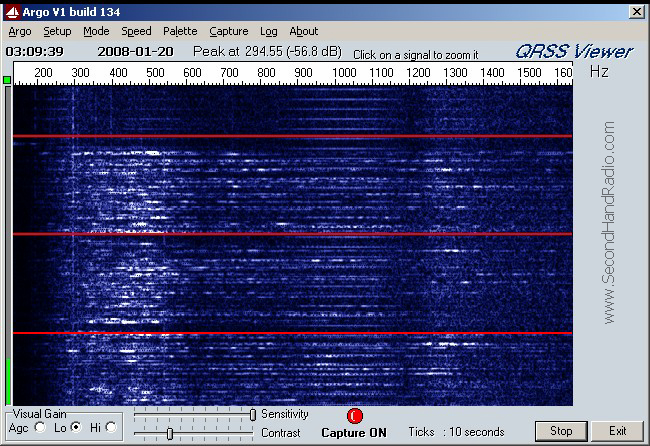
02:14:10 est, after adjusting the Argo program, we can see the varying signal
strength of signals from
HAARP. No sign of any echoes.
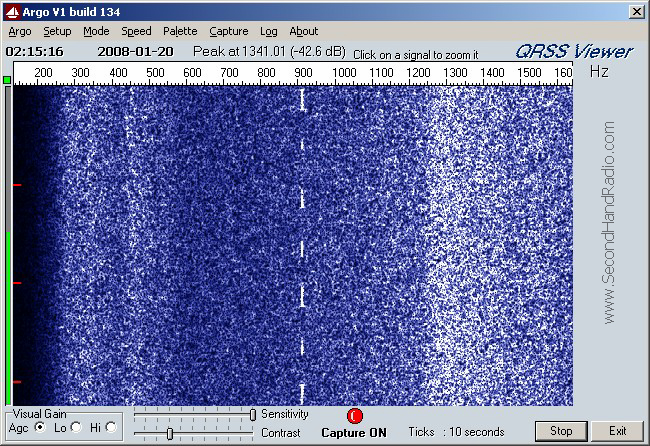
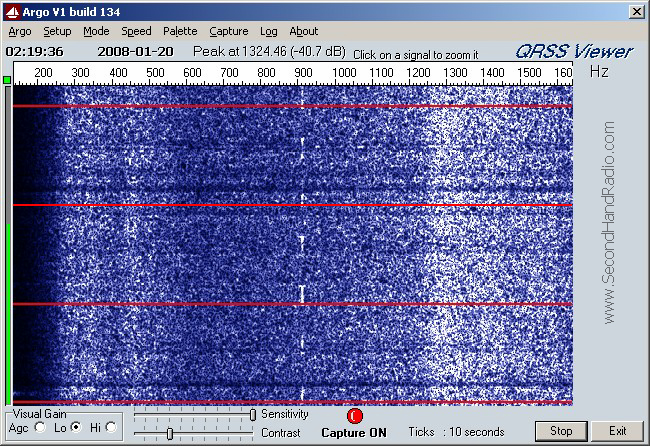
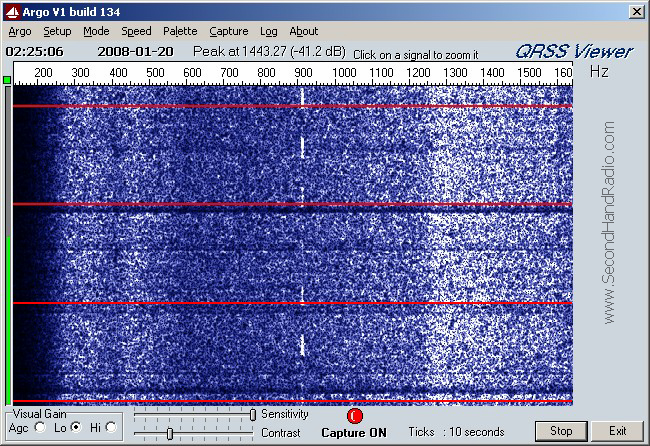
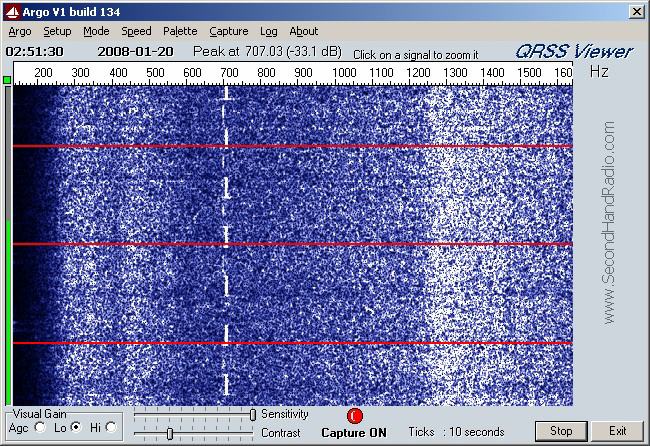
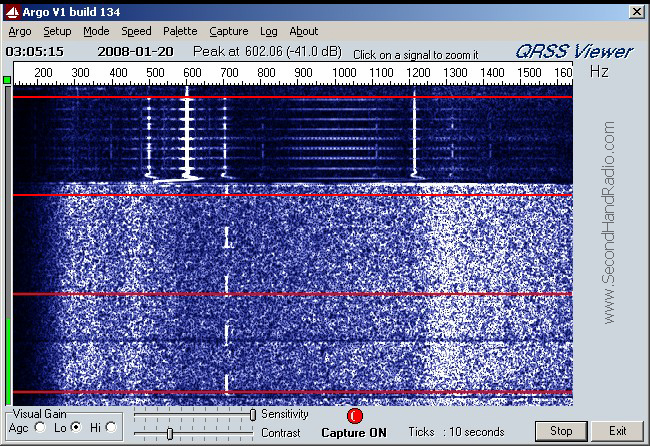
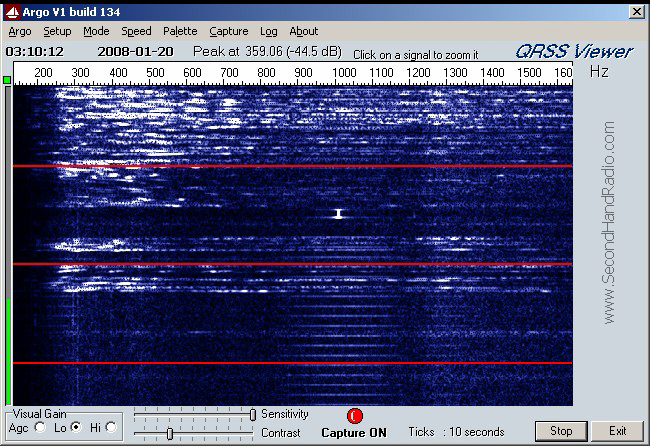
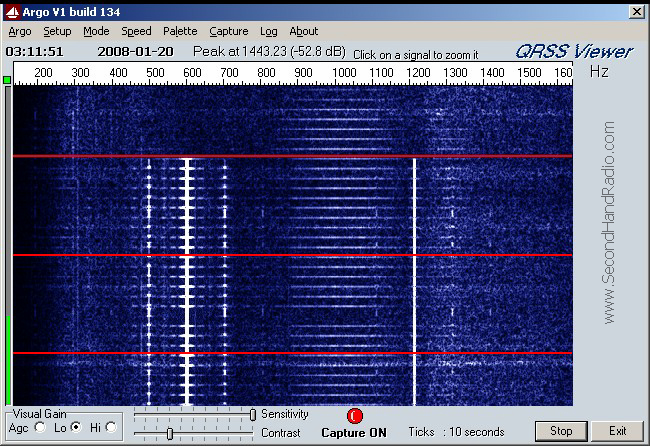
I changed the settings in Argo so now the time markers go completely across the
image. They are
10 seconds apart. In the image below you can see that there are exactly 2
transmissions in each
10 second period.
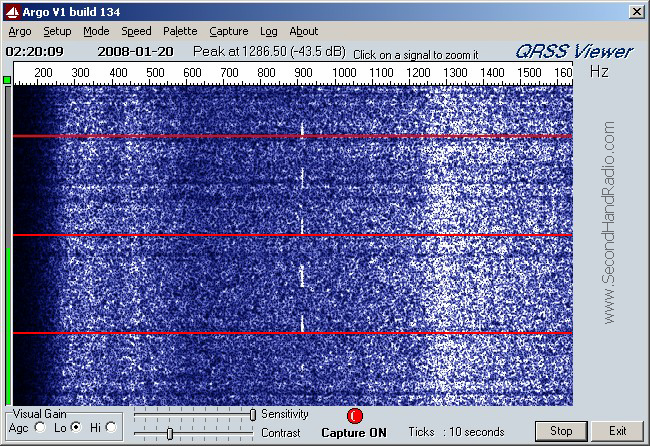


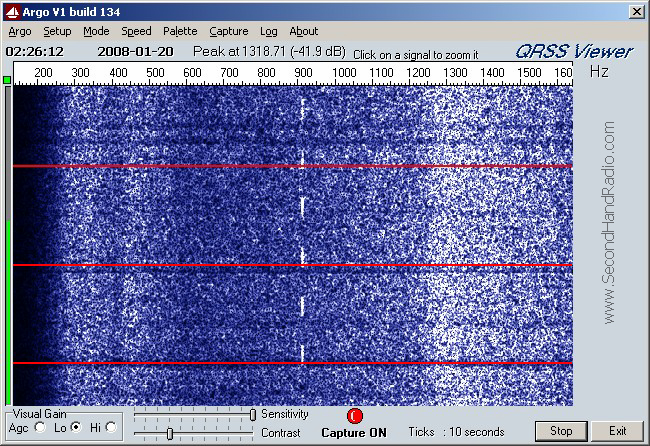
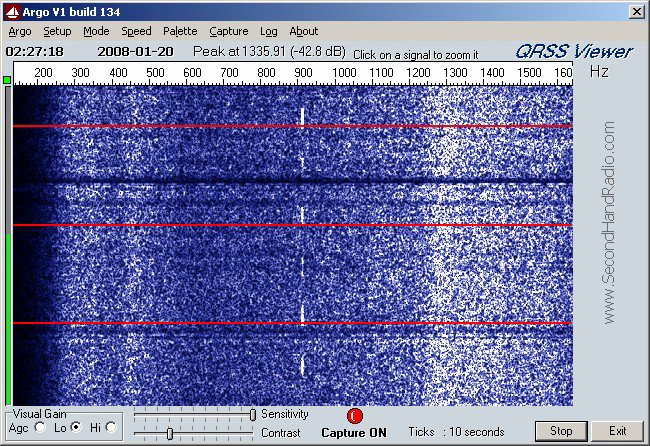
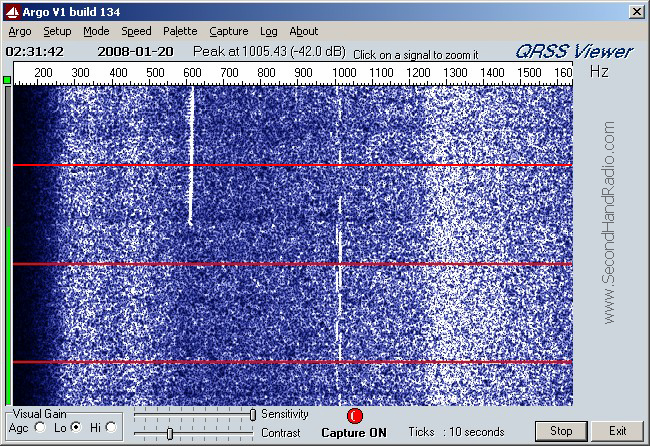
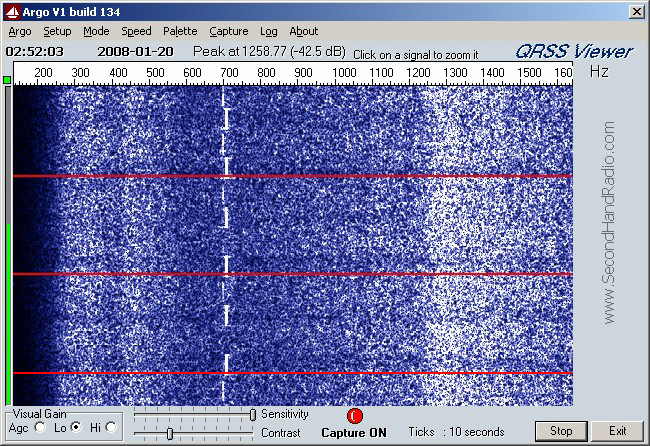
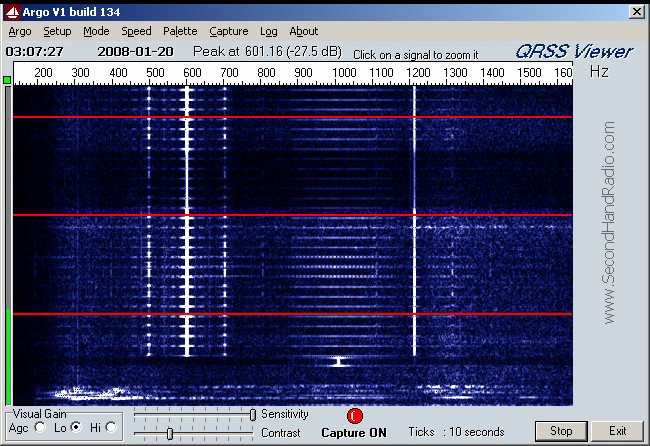
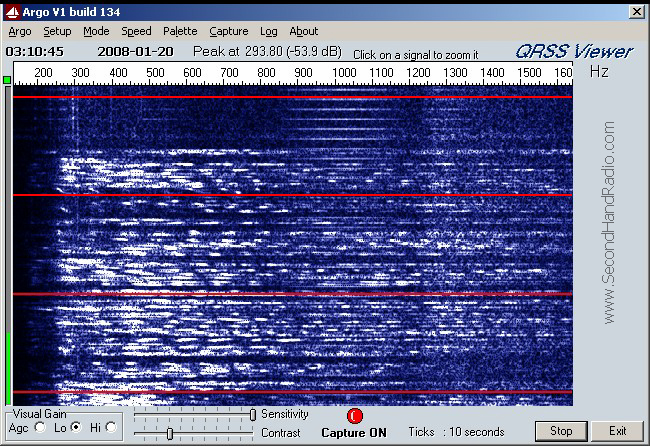
The published schedule announced that the HAARP would transmit on 7407.5 kHz at
02:30 eastern.
At this time, the transceiver was adjusted for an indicated frequency of 7406.5
kHz in the USB mode.
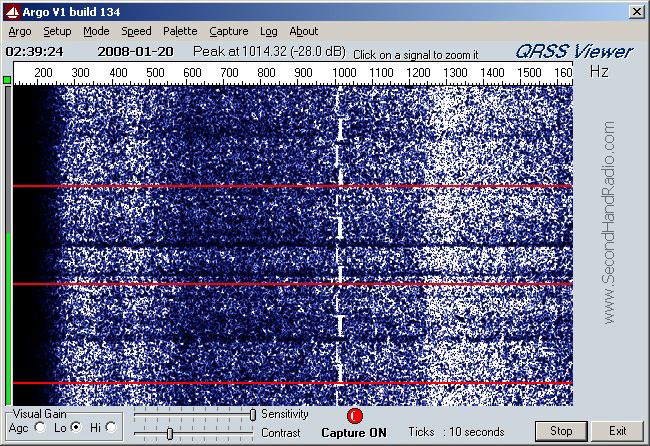
We can see the HAARP transmitter at 1010 Hz in these captures. Also there
is some temporary inteference (I assume that's what it is) at 1000 Hz and at 620 Hz.
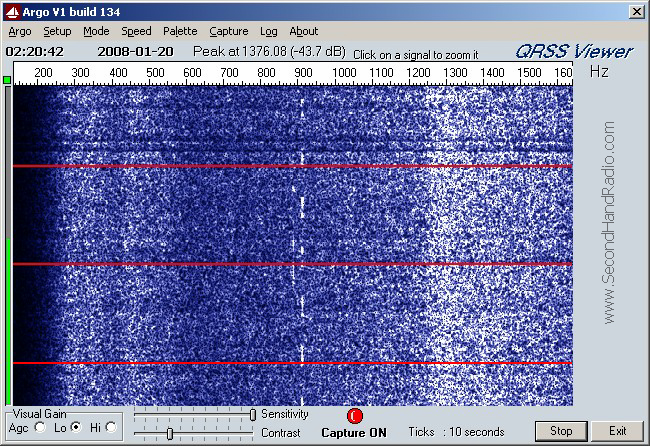
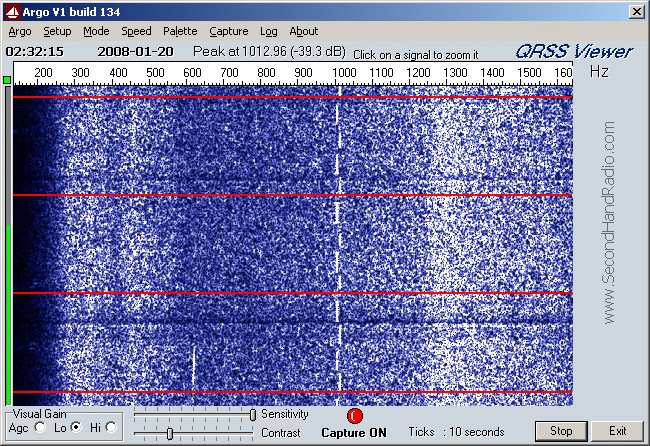
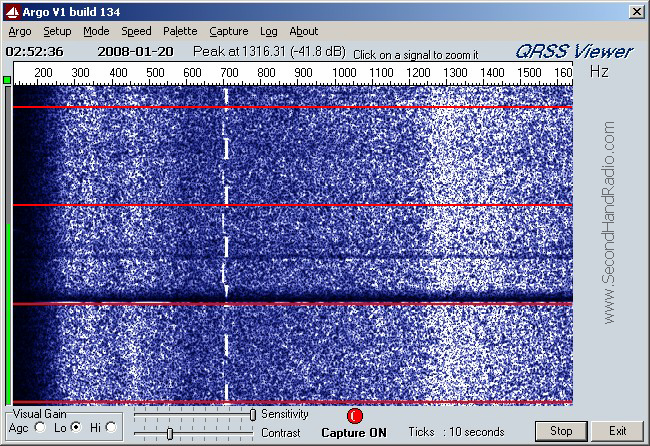
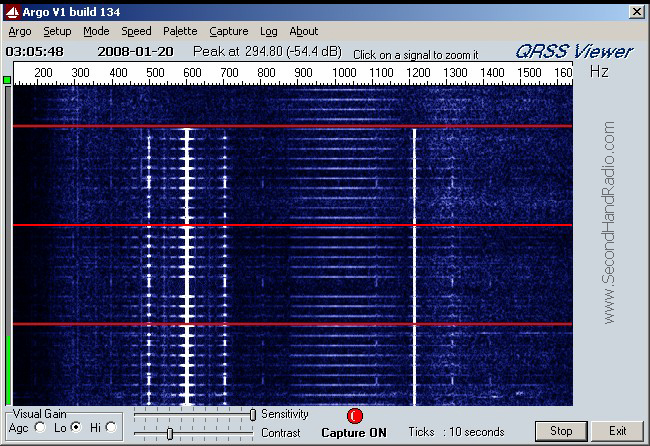
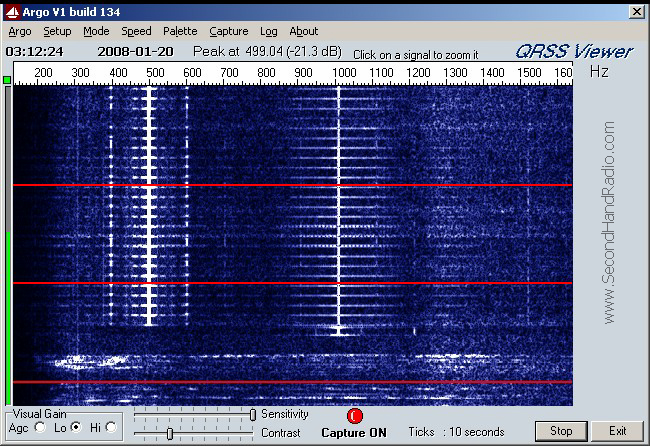
This next image, completed at 02:32:15 local time clearly shows the echoes from
the moon. If you notice
in the earlier images, the HAARP transmissions start almost exactly on the red time
marker (a few pixels
before it actually) and show at 1015 Hz in these plots. The HAARP trasnsmissions
are shown here.
Then notice the echoes from the moon! These appear to be at 1000 Hz due to the doppler
shift. (My QTH on earth was rotating away from the moon. (The HAARP facility indicated that doppler would have been approximately 7 Hz. )
The round trip from earth to moon to
earth (E-M-E or EME)
is approximately 2.4 seconds so the moon echoe begins approximately 0.4 seconds
after the end of
each HAARP transmission.
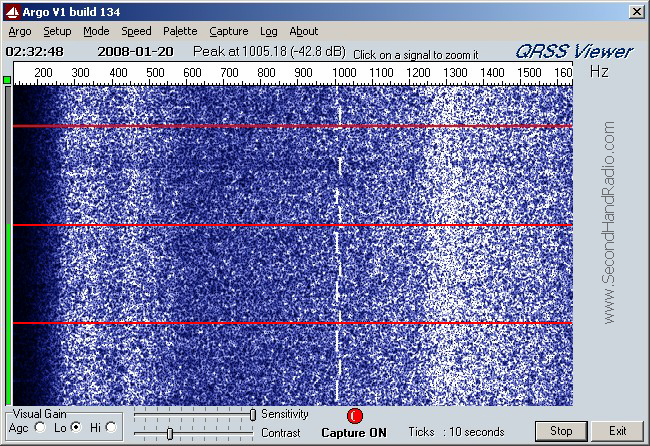
At 02:32:48 est we see the moon echoe fade away.
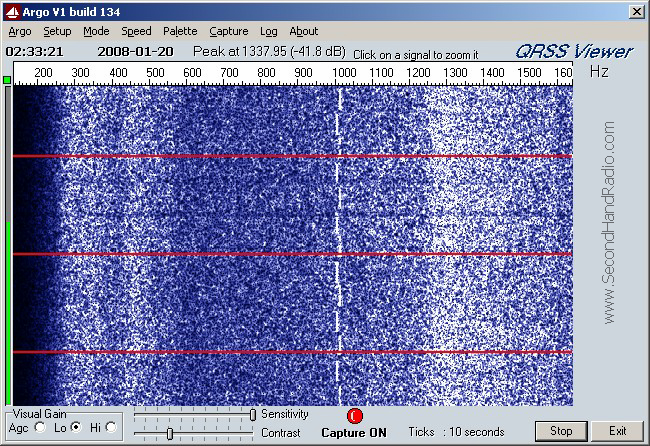
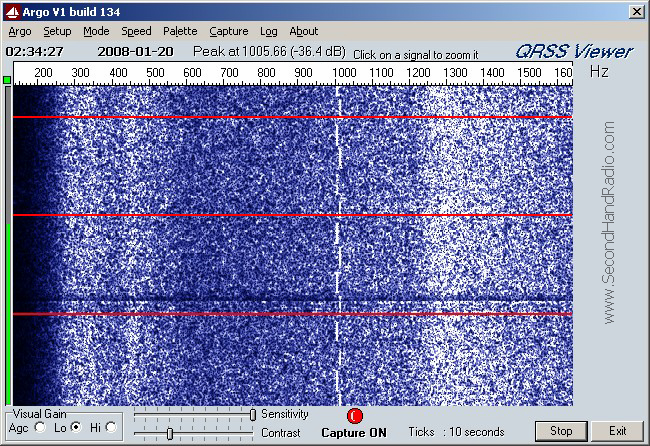
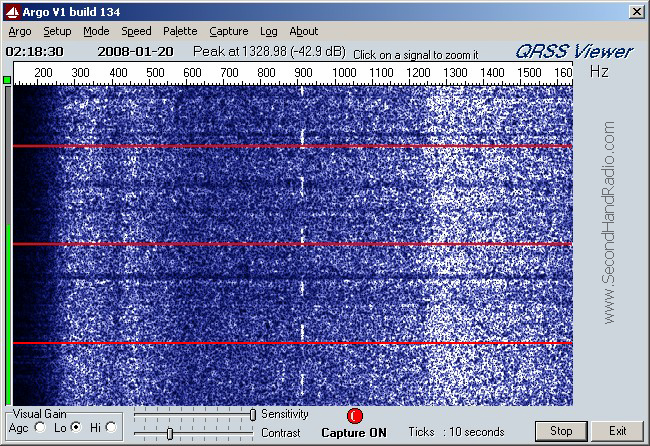
This image is for the period 02:34:30 through 02:35:00 est. Look at the very bottom
of this capture.
You can see that the moon echoe was stronger than the signal 'directly' from the
HAARP station.
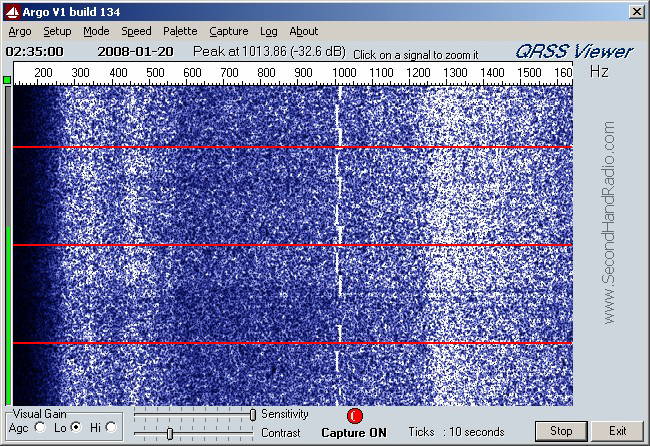
This appears to show some type of interference. Quite possibly some ham using
his "built-in antenna tuner"
doesn't realize that they are transmitting a very small amount of power when they
do so.
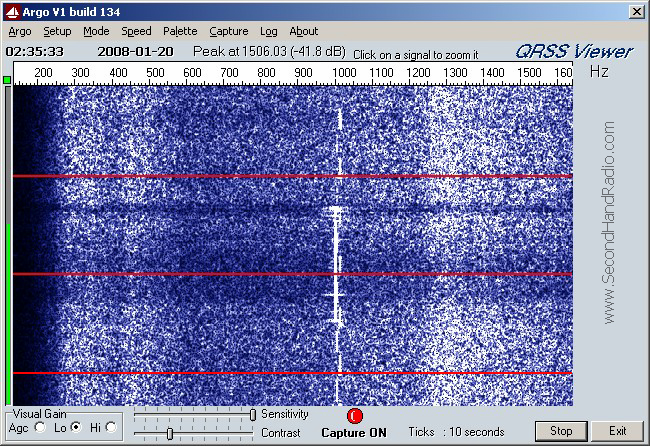
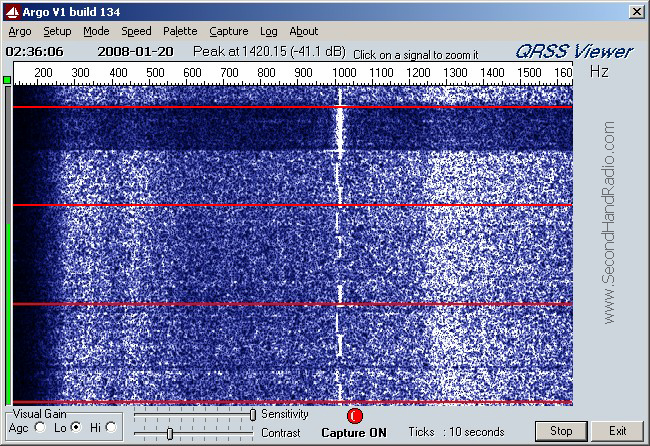
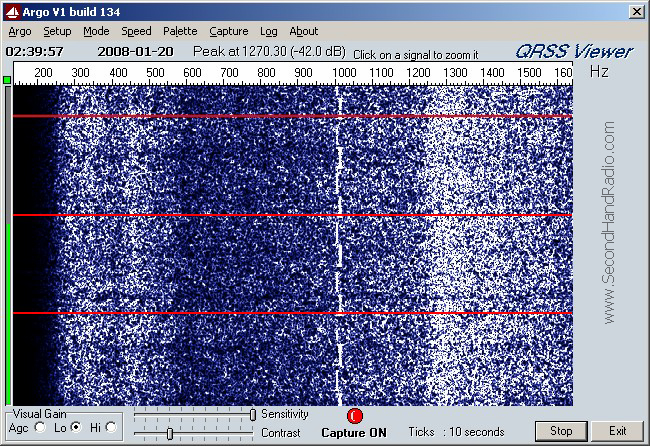
A few seconds before 02:36:06 local we see a very strong signal exactly on the HAARP
transmit
frequency. It is strong enough that the receiver AGC reduced the RX output,
thus the dark band
across the entire spectrum during this few seconds. I do not know what this
might be. Moon echoes
are still visible most of the time.
In this image, I was trying different settings in the Argo program. I tried
the setting called "mag squared".
The previous images were set to "mag".
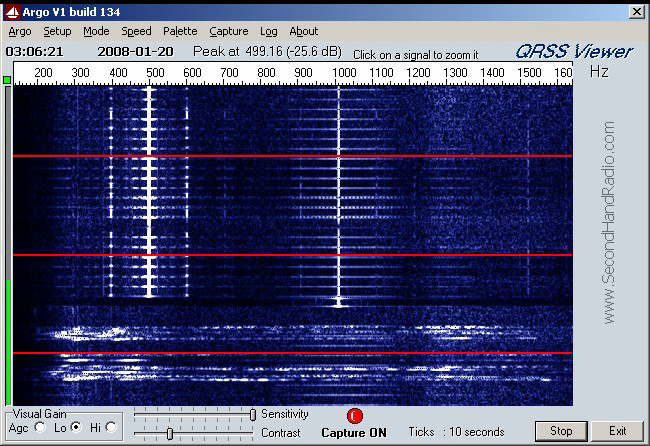
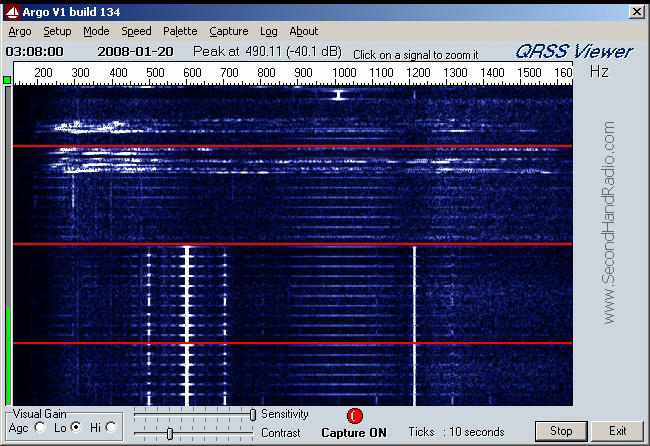
At 02:40 est, I changed the RX to an indicated frequency of 7406.8 kHz USB.
The result of this is that
the HAARP transmissions now come out of the radio speaker at 710 Hz. You
can actually see the
receiver moving to the new frequency right after the first time marker near
the bottom of the image.
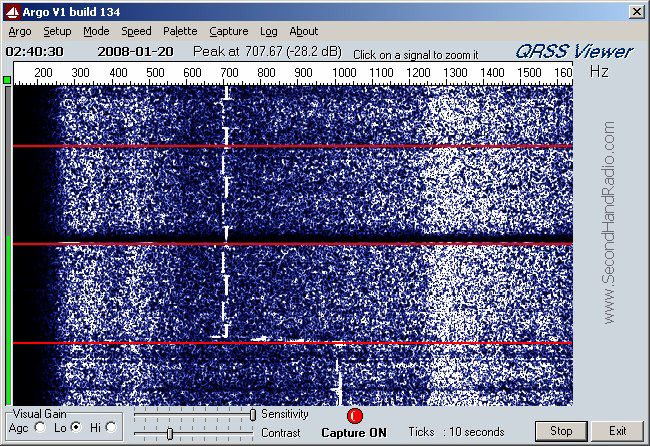
I think that when I changed my receiver frequency that this made the HAARP signals
and the moon
echoes much easier to see. (710 Hz and 700 Hz respectively).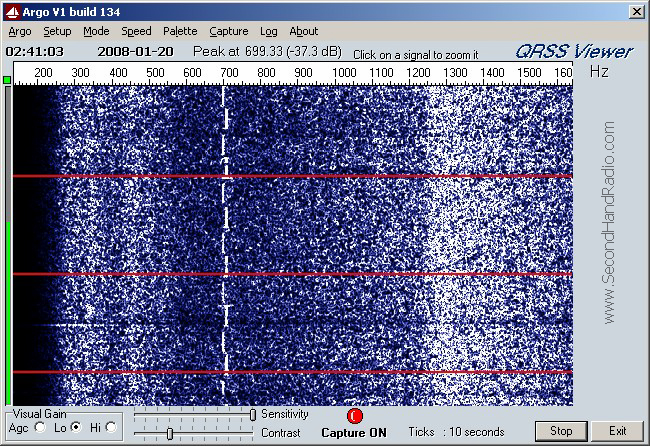
At 02:41 I switched the Argo program back to "mag" display. I think I like
this better.
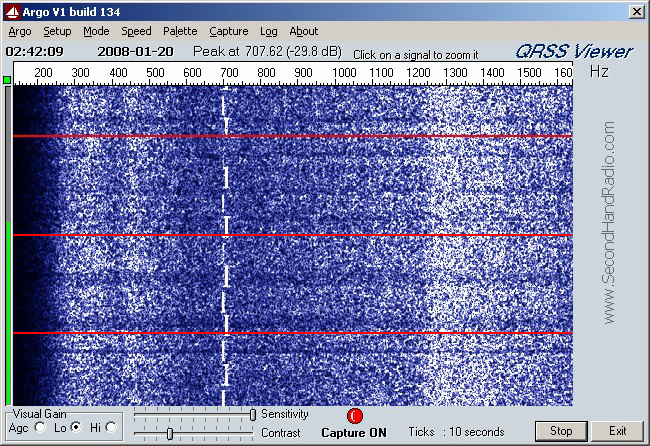
02:42:42 est echoes are quite weak if they are there at all.
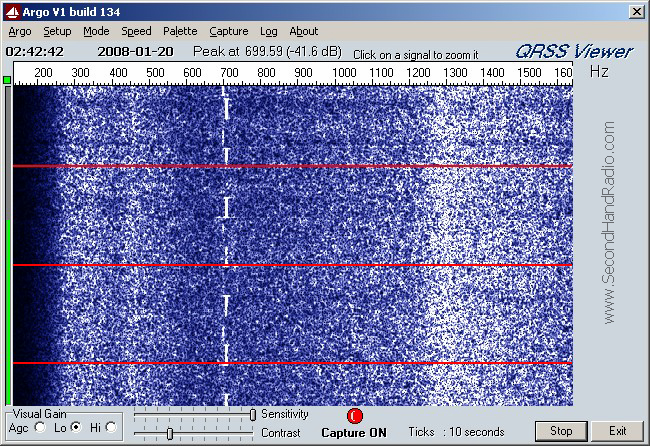
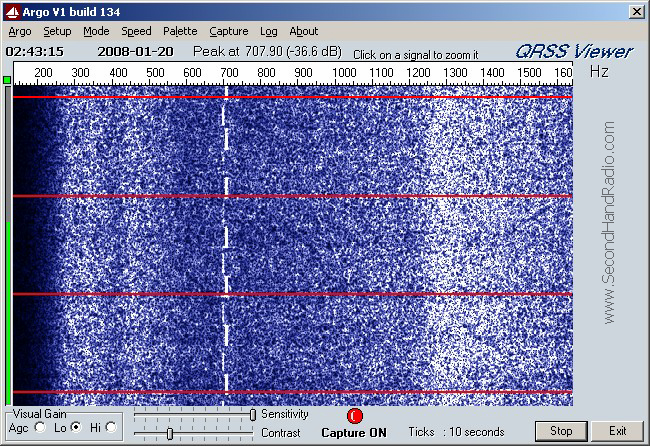

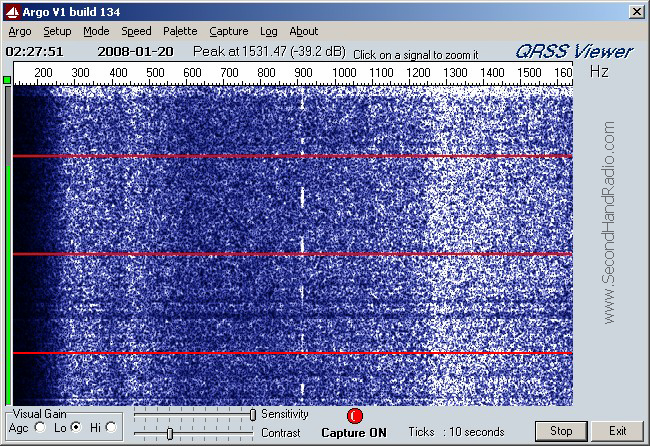
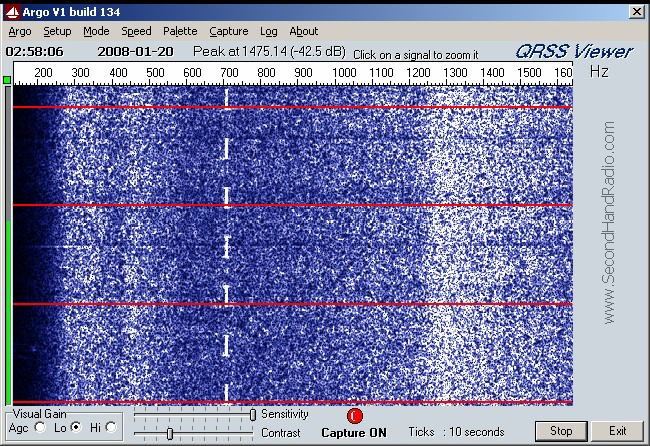
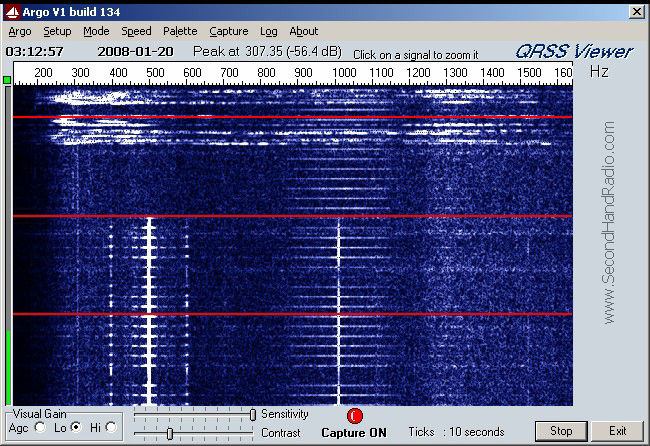
In this image and the next, you can see at times the HAARP signal is getting much
stronger (whiter).
"where have all the echoes gone?"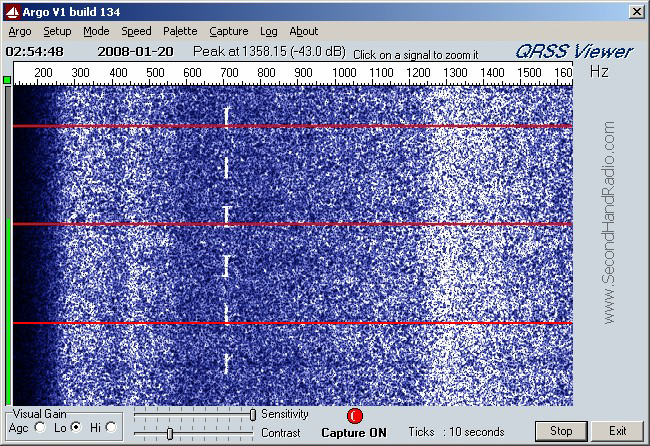
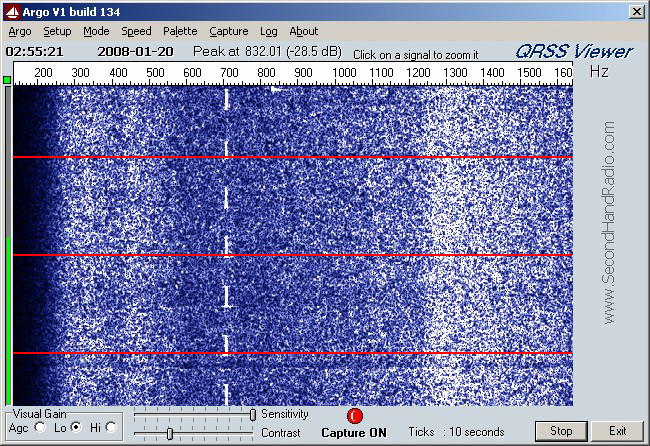
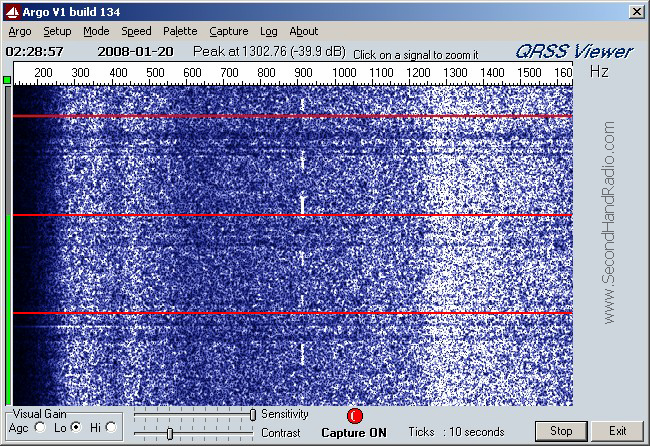
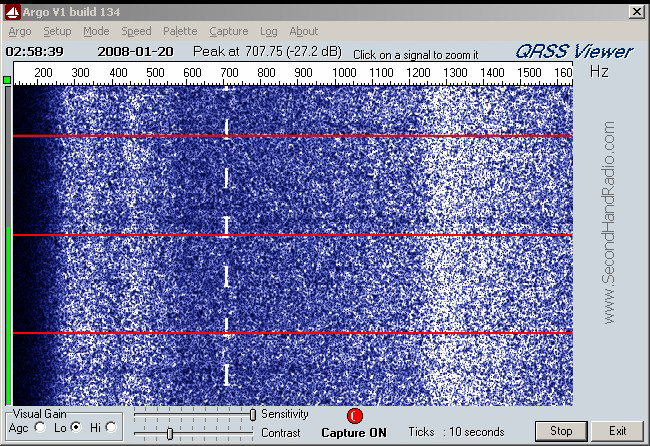
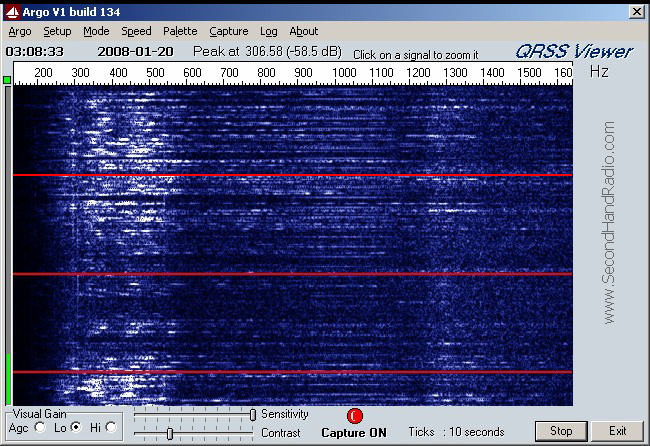
Another momentary unexplained signal at 02:55:43 est.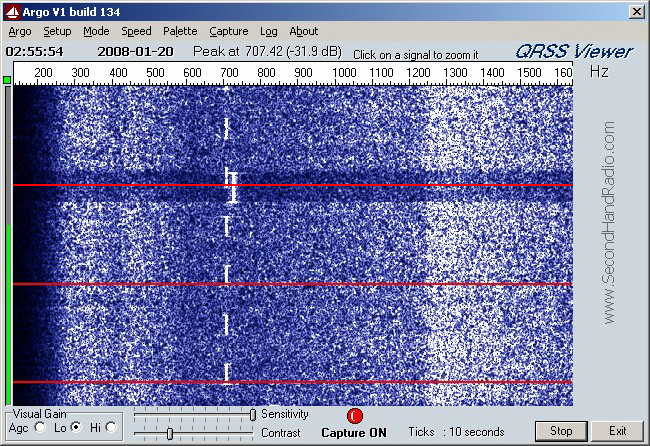
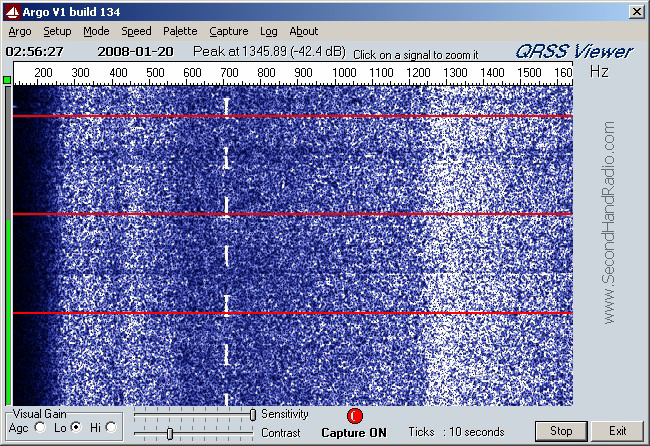
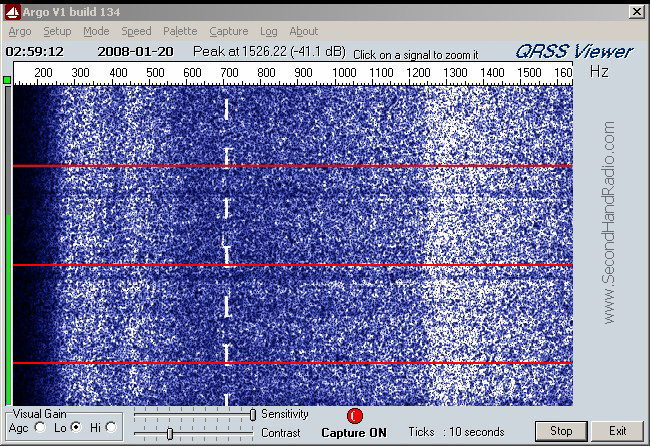
Did the HAARP station take a 30 second rest at 02:59:30 local time ?
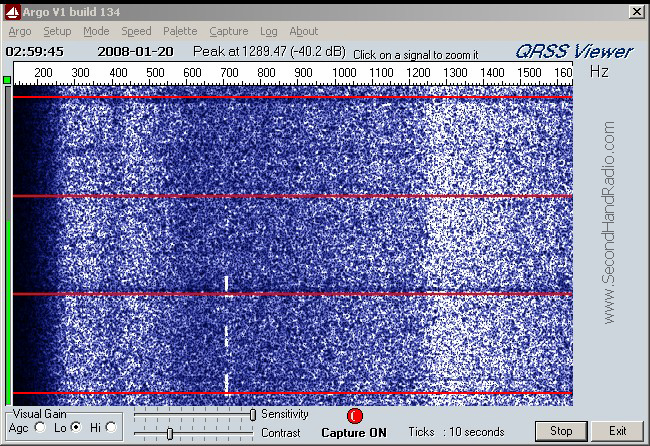
And then resume the HAARP transmissions at 03:00:00 est ? Or was this a fade that
just happend to
occur exactly 30 seconds before the hour for 30 seconds?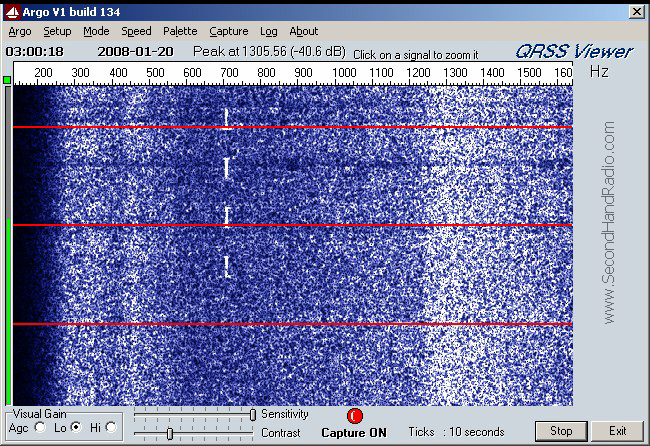
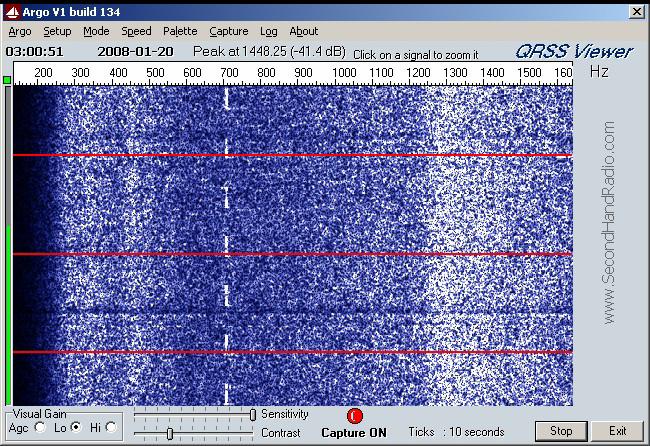
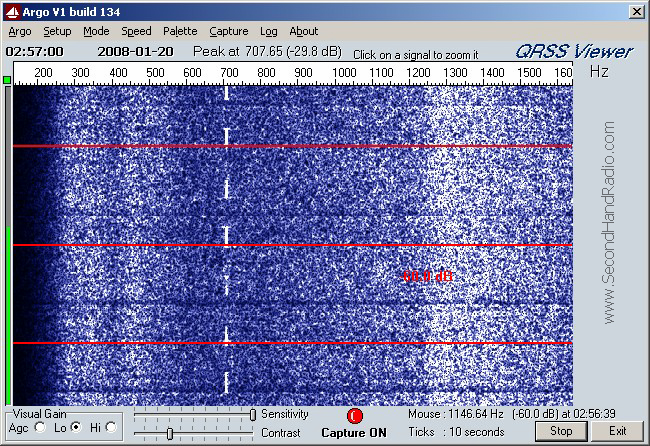
I have not seen any echoes in quite a while. I am very sleepy. WAIT
! Before turning everything
off, lets get some good reference material for this experiment. Just before
03:05 I set the TW100F
to 10000.00 kHz. This is the 10 MHz WWV frequency standard station.
This gives us the opportunity
to calibrate the frequencies we have been seeing. Just above the red time
marker line that is second
from the top, you can see the RX synthesizer hunting for its new setting.
(Hey , this rig was manufactured
in 1979. Synthesizers were pretty slow back then.)
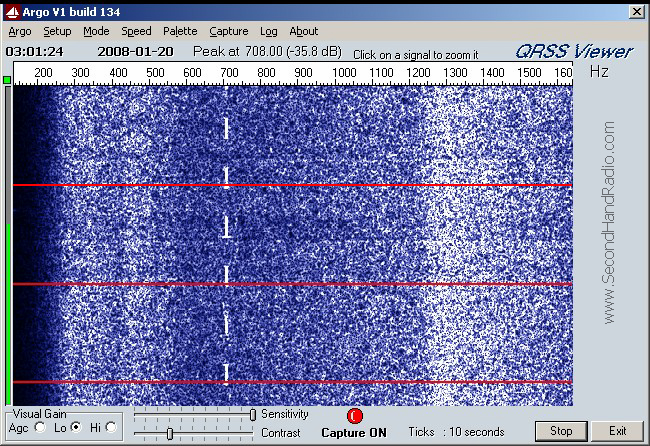
If you know the time signal formats from the National Institute of Standards and
Technology you can
pretty much read what time it is just by looking at this plot.
At the bottom of this plot the male voice is announcing the time. The very intense
signal at 1010 Hz
(out of my receiver) marks the beginning of the minute. If my receiver was
perfect, this signal would
have been 1000.0 Hz.
The marker for the beginning of the minute is easy to see in this shot. It
is at 1010 Hz . Then the rest of
the minute has ticks at 600 Hz.
And now a bunch of voice announcements on WWV.
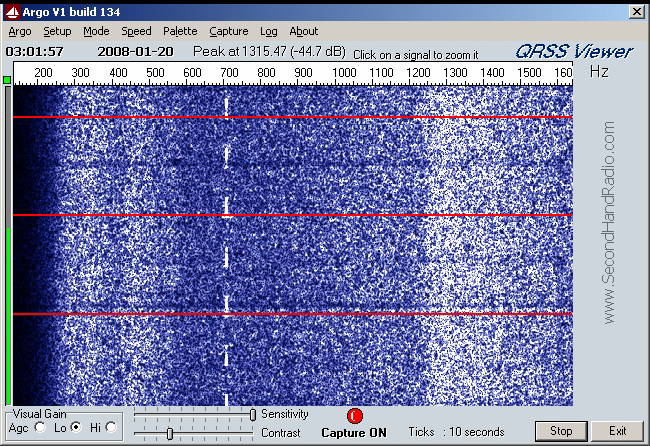
I am pretty sleepy, but lets tune back to 7406.8 kHz again for a few minutes.
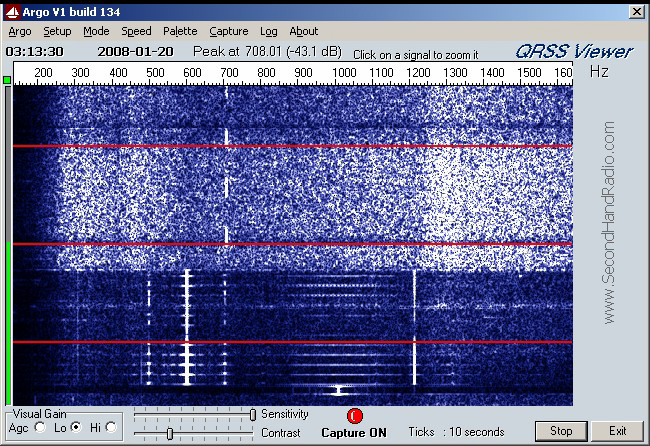
This was an interesting "catch". If you listen around on HF frequencies
you occasionally hear a VERY strong signal that sounds like "Baaaaaaaaaaaaaaaaaaa"
and it seems to be "everywhere". Well at 03:13:50 or so we can see it.
It's that 'herringbone pattern' at the top time marker.
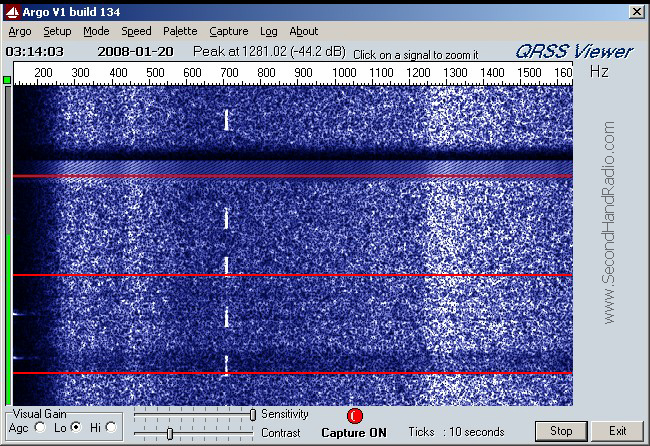
No more echoes.
Sleep.... sleep.... you are getting very sleepy...... .go to bed now! It is
03:16 eastern standard time. Even
the cat is asleep.
|
|